He whakatakinga | Introduction
This Summary Report is an overview of the financial and non-financial service performance for Year Two of Greater Wellington’s 2021-31 Long Term Plan.
View the full 2022/23 Annual Report (PDF 48 MB)
This Summary Report does not include the full financial disclosures and detailed financial information that are in the full Annual Report.
Disclaimer
The specific disclosures included in this Summary of the 2022/23 Annual Report have been extracted from the full 2022/23 Annual Report. The Summary cannot be expected to provide as complete an understanding as provided by the full annual report of the financial and service performance, financial position and cash flows of the Greater Wellington Regional Council. The Summary has been examined by the auditor for consistency with the full annual report audited by Audit New Zealand on behalf of the Auditor-General. A qualified audit opinion was issued on 31 October 2023. This Annual Report summary was adopted by the Council on 31 October 2023.
He karere nā te Heamana me Te Tumu Whakarae | Message from the Chair and Chief Executive
Kia ora koutou,
In short, this year has been one of change – some positive, and some challenging.
In October 2022 we welcomed in a new Council – including five new Councillors – and re-elected the Chair. The new Council have shown a commitment to delivering for the environment and climate, delivering a reliable public transport network, and partnering with mana whenua.
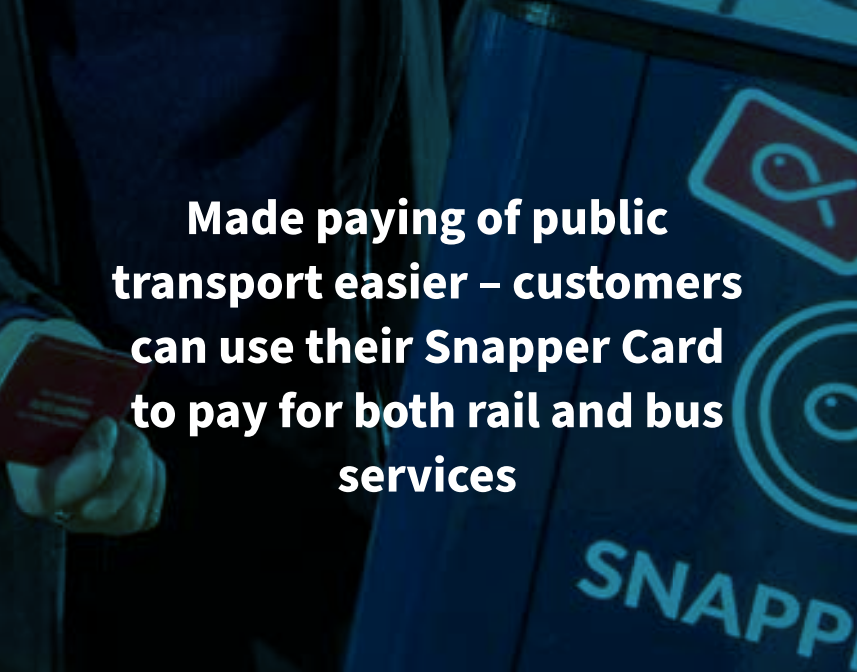
At the start of the year the impacts of COVID-19 on frontline public transport staffing levels was being felt by public transport operators across New Zealand. These staffing impacts had a major flow-on effect to Greater Wellington’s Metlink Public Transport services, so we worked with our public transport operators and Central Government to support changes to driver wages and hiring conditions. In February 2023 we had a shortage of 120 drivers across our public transport network, and by June 2023 the shortage was down to 83, with all signs indicating that trend will continue to improve into 2023/24. While this systems-changing work was ongoing, we also made it easier for people to pay for public transport with the full rollout of Snapper on Rail, and payWave options for the airport bus services.
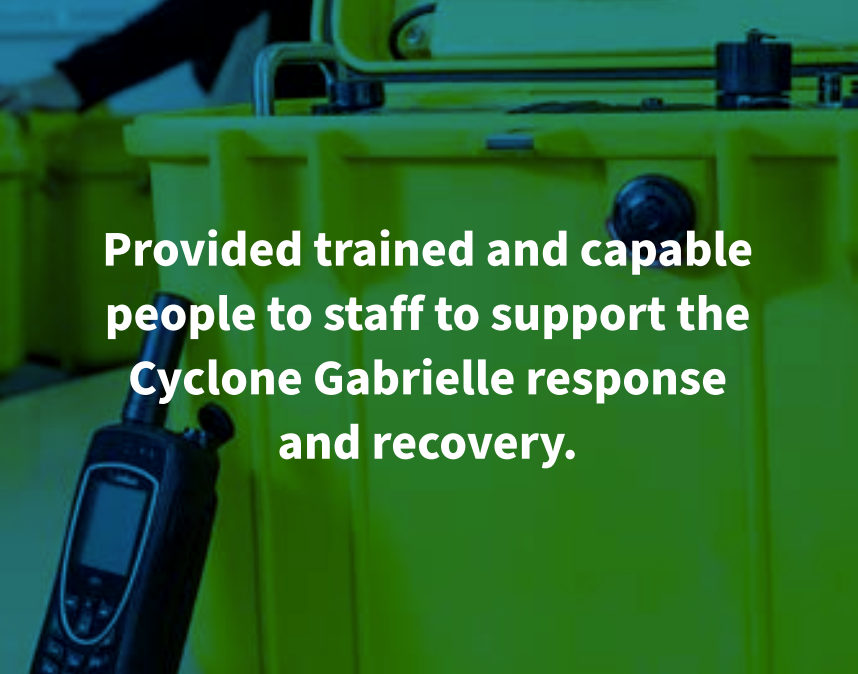
Ex-tropical Cyclone Hale and Cyclone Gabrielle hit New Zealand one after another in early 2023, causing severe impacts and disruptions to communities across the North Island, including the Wairarapa. We supported the response and recovery in our own Region and sent trained staff to support the national coordination centre and the response in other regions. These storms and other severe weather events throughout the year had a major impact on many of our environmental restoration activities, requiring us to pivot some our work to manage the impacts.
We have continued to work closely with our mana whenua partners this year. We established a Long Term Plan Committee of Council which includes one representative from each of Greater Wellington’s six mana whenua partners, and also established a Te Tiriti Komiti of Council. We commenced a Te Tiriti o Waitangi internal audit, which includes feedback from our partners, and continued the momentum from last year in progressing our commitment to Te Whāriki – our Māori Outcomes Framework.
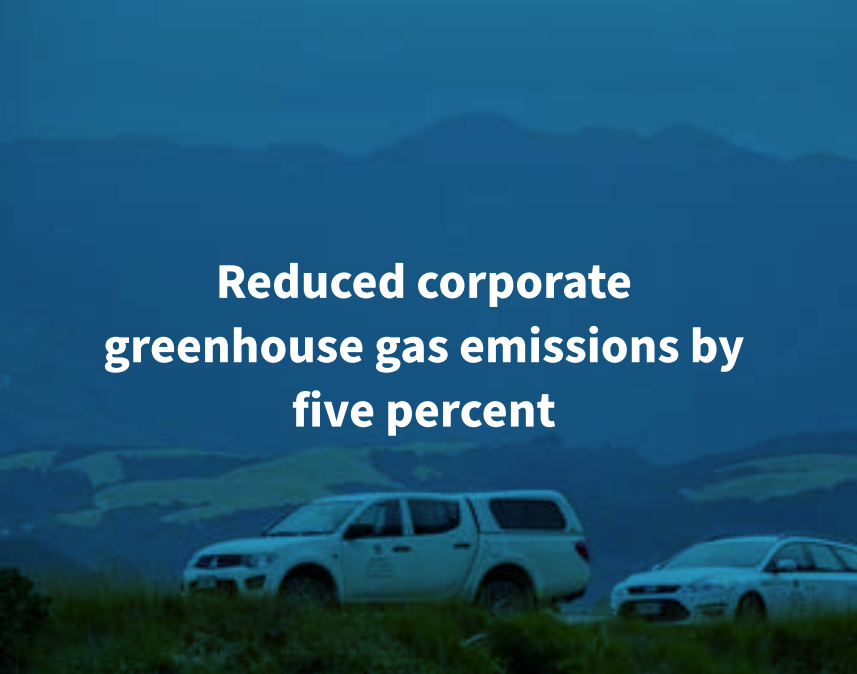
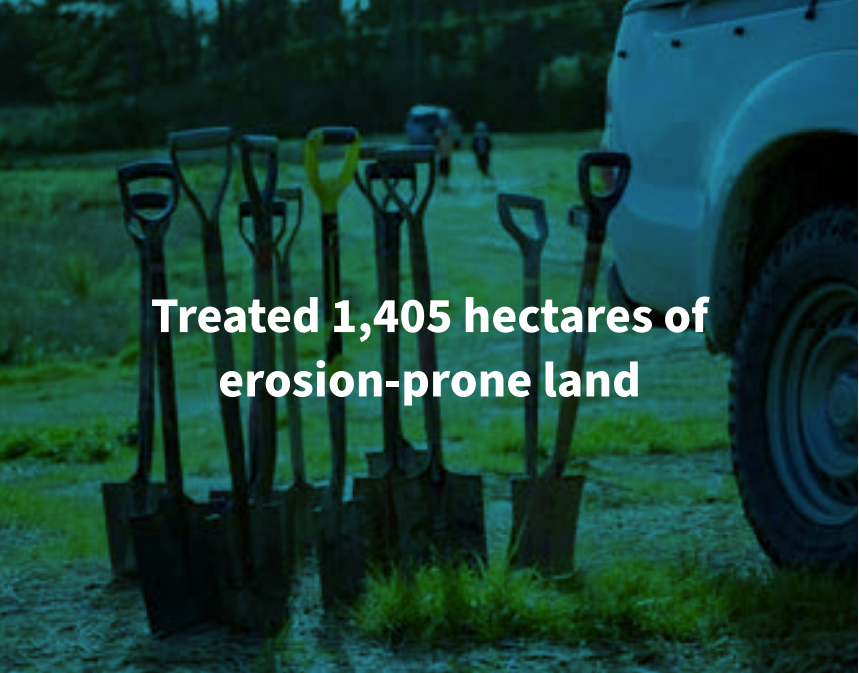
Climate change was another big focus for us this year. We reduced our greenhouse gas emissions five percent from our baseline and increased the number of electric buses in our public transport fleet to a total of 98. We improved flood protection for our communities, including commencing work on Te Wai Takamori o Te Awa Kairangi | RiverLink project in Hutt Valley, and built more natural resilience to climate change by restoring habitats and healthy ecosystems, treating erosion-prone land, and retiring grazed land in Regional Parks.
We are proud of our achievements and grateful to everyone involved. Thank you to all the people who made this year possible – our mana whenua partners, partner agencies in central and local government, communities, our staff, and volunteers.
Ko te Tau kua pahure | A Year in Review
We are proud of the mahi we achieved this year. Highlights include:
Ko ngā hua mō te hapor | Community Outcomes
We promote the social, economic, environmental, and cultural well-being of our communities through our three community outcomes:
- Thriving Environment: healthy fresh and coastal water, clean and safe drinking water, unique landscapes and indigenous biodiversity, sustainable land use, a prosperous low carbon economy.
- Connected Communities: vibrant and liveable region in which people can move around, active and public transport, sustainable rural and urban centres that are connected to each other, including mana whenua and mātāwaka Māori communities.
- Resilient Future: safe and healthy communities, a strong and thriving regional economy, inclusive and equitable participation, adapting to the effects of climate change and natural hazards, community preparedness, modern and robust infrastructure.
The table below shows Community Outcomes through the lens of each of our Activity Groups.
|
Activity Group |
Thriving Environment |
Connect Communities |
Resilient Future |
|---|---|---|---|
|
Environment and Flood Protection
|
We look after the region’s special places to ensure they thrive and prosper |
Our work with the community connects people with the environment they live in |
We manage and protect the region’s resources so they can be enjoyed for generations to come |
|
With electrification of our network, we are creating a more sustainable and low carbon region |
People can get to the places they want to go to by using an accessible and efficient network |
People can move around the region on a public transport network that is future proofed |
|
|
Regional Strategy and Partnerships
|
We lead from the front to ensure our environment is front and centre |
People are engaged in the decisions that affect them |
We plan for the big issues by connecting the dots, ensuring the future is resilient |
|
|
Water supply is respectful to the environment that we live in |
The region has sufficient water supply that is of high quality and safe |
Bulk water supply is sustainable to the community as our environment changes |
Ko ā mātou whakaarotau rautaki matua | Our Overarching Strategic Priorities
Greater Wellington identified four key overarching strategic priorities as part of the 2021-32 Long Term Plan. These overarching priorities are woven across each Activity Group.1
|
Improving outcomes for mana whenua and Māori |
Proactively engage mana whenua and mātāwaka Māori in decision making, and incorporate Te Ao Māori and mātauranga Māori perspectives, so we can achieve the best outcomes for Māori across all aspects of our region. |
|
Responding to the climate emergency |
Meeting the challenge of climate change by demonstrating leadership in regional climate action and advocacy, and ensuring our operations are carbon neutral by 2030. |
|
Adapting and responding to the impacts of COVID-19 |
Take a leadership role in responding to the economic consequences of COVID-19 and support the region’s transition to a sustainable and low carbon economy. |
|
Aligning with Government direction |
Rise to the challenges set by Central Government to ramp up environmental protection and continue to provide high quality public transport services. |
1.To see how we are delivering on these priorities see the full 2022/23 Annual Report

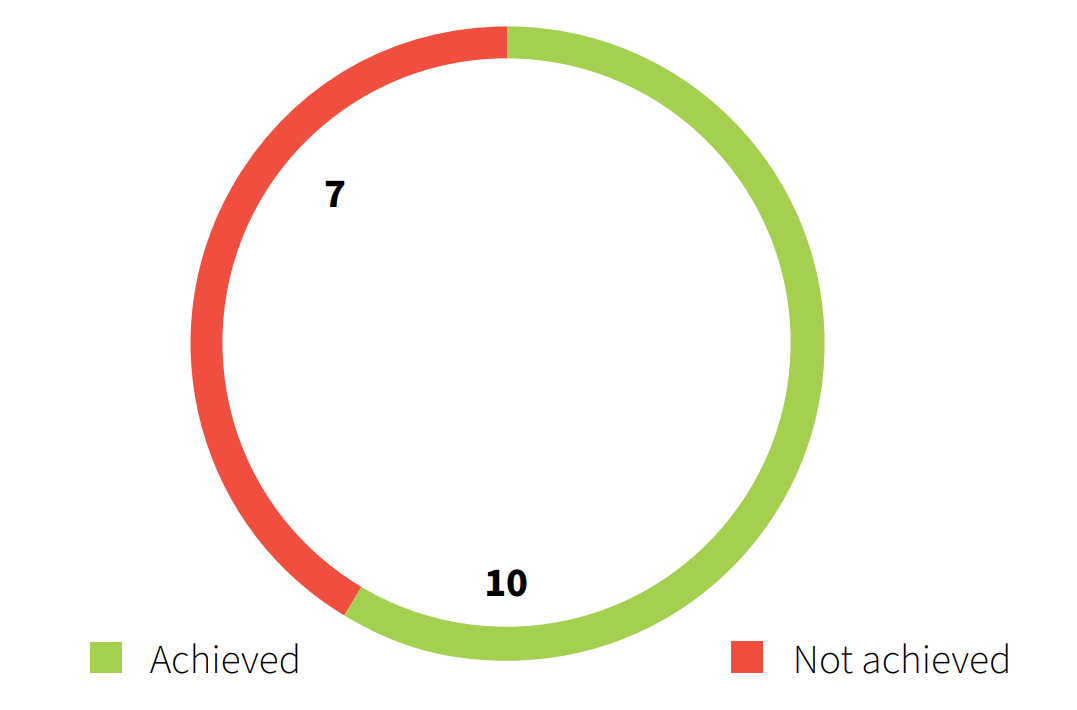
He whakarāpopototanga o te tiro whānui i te rawa | Summary of Non-financial performance
Overall Greater Wellington achieved 59 percent (30) of our non-financial performance measures and did not achieve 41 percent (21) of the measures.
We faced several challenges in our operating environment which impacted our ability to achieve our performance measures including:
- Cyclones and severe weather impacted most outdoor work, particularly environmental restoration, and pest management.
- Shortages with frontline public transport staff and rail disruptions caused service cancellations and delays to the public transport network.
- Ongoing staffing and resourcing challenges have had compounding impacts across various projects and programmes.
- A significant scale and rate of change for many Central Government agencies and policies have slowed down progress on some work.
You can read more about our non-financial performance in the full 2022/23 Annual Report Section Two: He tiro whānui i te rawa | Non-financial performance
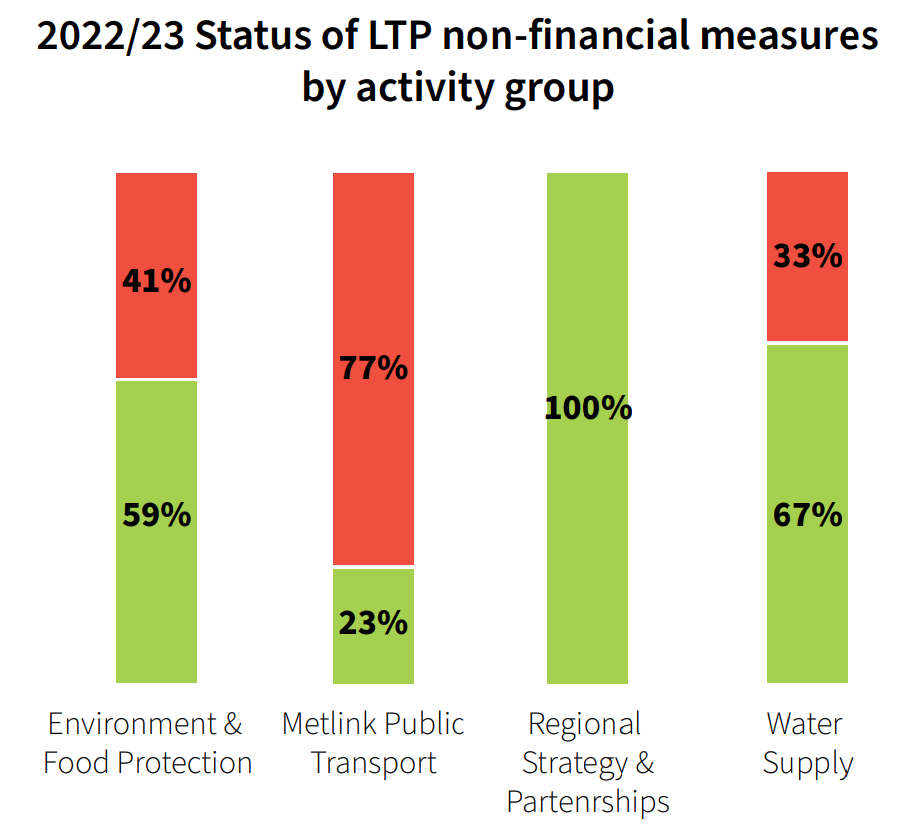
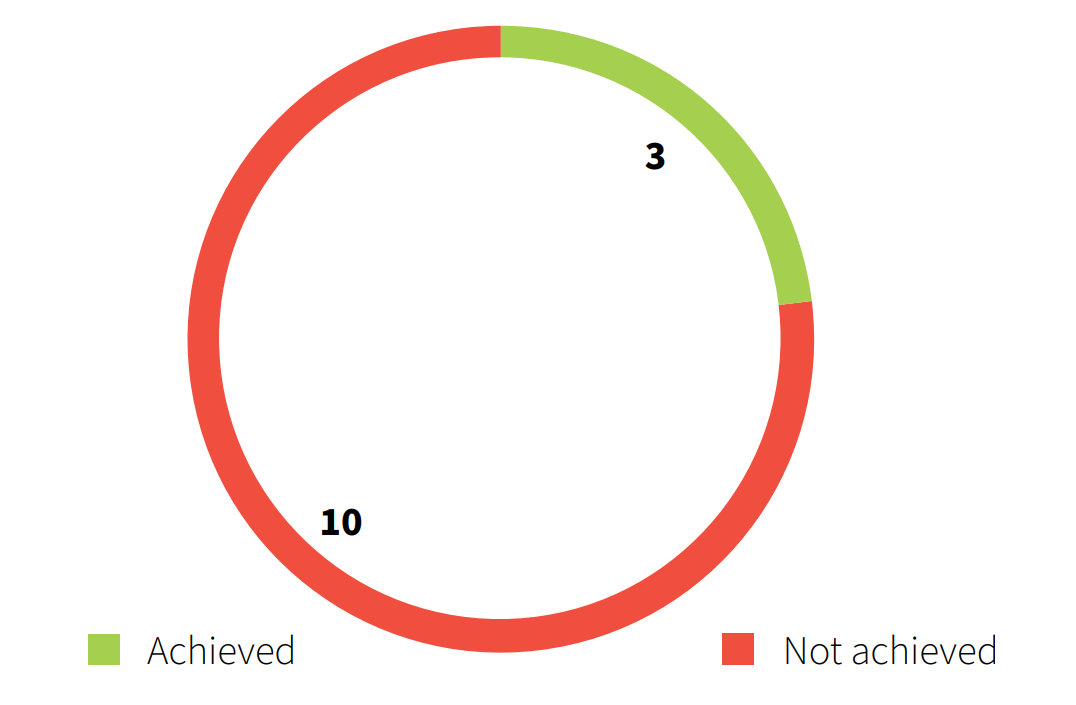
Ko te Haumaru Taiao me te Waipuke | Environment and Flood Protection
22/23 Status of non-financial performance
Greater Wellington’s Environment and Flood Protection activities achieved 59 percent of their seventeen performance measures this year. 2
Severe weather events, including Cyclone Gabrielle, presented challenges this year. These weather events affected the delivery of our work programme, and we had to re-prioritise to make sure we were delivering the most important work to our community.
Despite these challenges, we have worked hard this year to deliver the essential work to protect and restore our environment.
We improved the health of our waterways through a lot of erosion prevention and riparian management across the Region. We also gained a better understanding of our water resources in the Wairarapa through the non-invasive skyTEM aerial surveying programme over the Ruamāhanga Valley, which will provides valuable insights about how water filters and cycles through the ground, and an overall better understanding of critical ground water resources.
We continued to protect and restore ecosystems alongside our community and mana whenua partners. We made progress on implementing the recommendations for the Ruamāhanga, Te Awarua-o-Porirua and Te Whanganui-a-Tara Whaitua programmes which were developed with the community and our mana whenua partners.
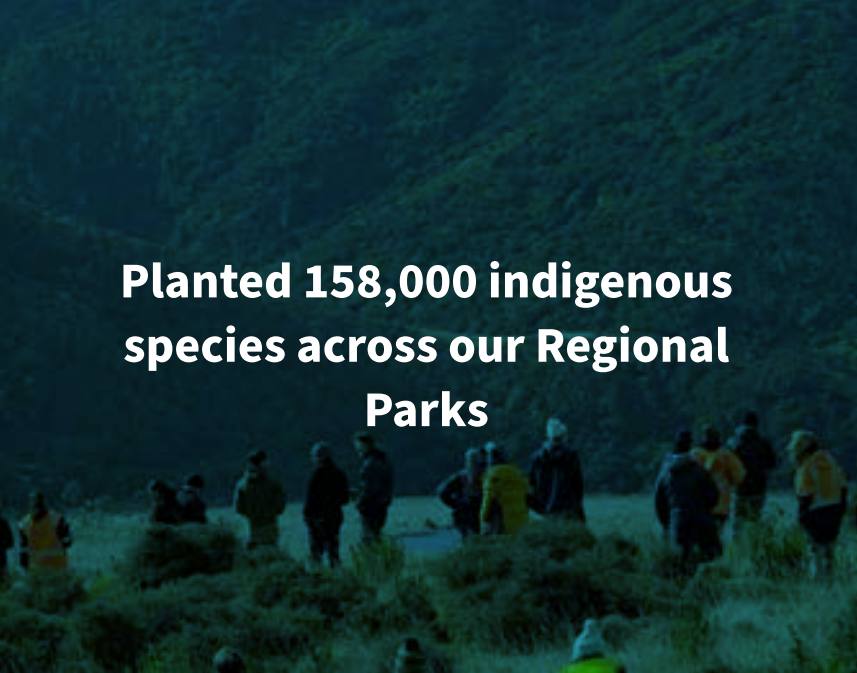
Our Recloaking Papatūānuku programme was advanced this year, completing the wetland restoration work at Queen Elizabeth Park, undertaking pest plan and animal management, and putting 158,000 new indigenous plants in the ground.
Our pest management programmes hit a significant milestone with all rats, possums, and mustelids eliminated from 80 percent of the Miramar Peninsula as part of the Predator Free Wellington Programme. This pest management is essential for our native plants and animals to thrive.
On top of delivering this critical work for the environment, we also started delivering our work in a more holistic and integrated way this year. In May 2023 we implemented a new operating model which allows us to better organise our staff, align our strategies and embed a focus on Māori outcomes. This model is supported by four focus areas for work ahead: co-design and co-delivery, working closely with communities; investing in new ways to manage flood risks; implementing Toitū Te Whenua Parks Network Plan; and Regional pest management focus on deer and goats.
An example of delivering work in an integrated way this year is our Natural Resources Plan graduating from proposed to be approved. This represents 12 years of mahitahi in partnership with Greater Wellington, mana whenua and communities. The Natural Resources Plan takes a holistic approach, whereas previous plans took separate approaches to manage air quality, freshwater, soil, and discharges to land and coastal areas.
2. See the ‘Measuring our Performance’ section of the full 2022/23 Annual Report
Ngā waka Tūmatanui | Metlink Public Transport
2022/23 Status of non-financial performance
Greater Wellington’s Metlink Public Transport activities achieved 23 percent of their thirteen performance measures this year. 3
We faced several challenges this year that affected our public transport services. There was a lot of work to address these challenges and continue to provide safe, accessible, and reliable bus, rail and ferry services to the community.
One of the biggest challenges was a shortage of bus drivers. We supported improvements to driver conditions, increased driver wages 4, and successfully lobbied Central Government to improve immigration rules and expand recruitment options. We are proud to say that the gap in driver shortages has decreased from 120 drivers in February 2023 to only 83 drivers in June 2023. We are on-track to have full complement of drivers by the end of September 2023.
There have been slips and slope stability issues on the Kāpiti Line and the work on the Wairarapa Line caused disruptions to rail services throughout the year. More significant disruptions occurred in May 2023 after Metlink was advised by KiwiRail that there were unforeseen technical issues with the Track Evaluation Car, which prevented important regular safety inspections of the rail network. There are two reviews being undertaken into KiwiRail’s response, which will help to prevent the issue from reoccurring.
Despite the challenges that we faced we have also done a lot of great work to improve our public transport system this year.
We commenced operation of the new Airport bus service in July 2022, providing an express service between Wellington Railway Station and Wellington Airport on a full electric fleet of buses which feather Wi-Fi and payWave. This service has proven popular, with 364,191 passengers in the first year of operation (28 percent more than forecast).
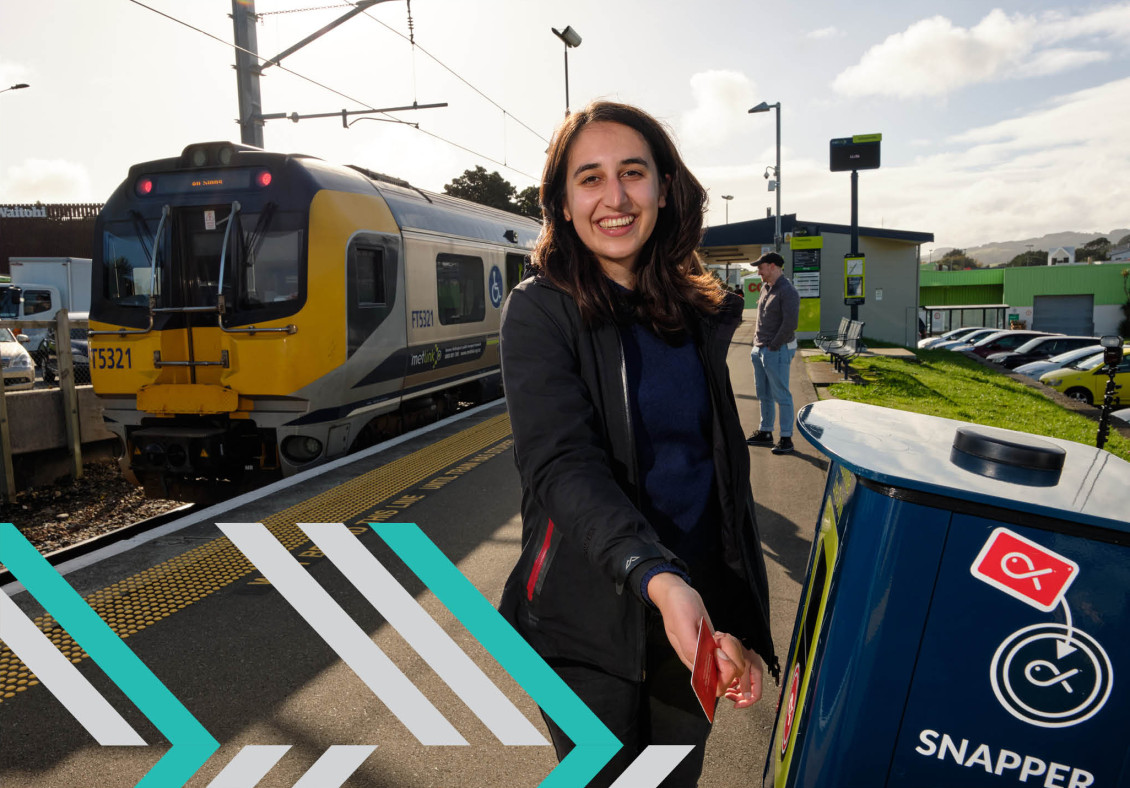
Snapper on Rail went live on the Kāpiti Line on 12 November 2022 and then on the Melling, Hutt Valley and Wairarapa Lines on 27 November 2022. This has had a positive impact on passenger satisfaction with the convenience of paying for public transport compared with the previous year.
We started the procurement process for 18 four-car tri-mode trains and associated infrastructure for the Wairarapa and Manawatū rail lines. These new trains are part of the Lower North Island Rail Integrated Mobility project to increase rail services and improve people’s experience of the rail network. We are expecting that peak-time rail services between Palmerston North and Wellington on the Manawatū line will quadruple and will double between Masterton and Wellington on the Wairarapa line.
We also talked to community about how public transport fares should change in the future, and in February 2023 Council agreed on several options for fare discounts and reduced fares. We also completed our annual fares review, and Council agreed to increase fares by six percent as of 1 April 2023.
3. See the ‘Measuring our Performance’ section of the full 2022/23 Annual Report
4. On 1 April 2023, bus driver wages increase to an average of $30 per hour for ‘urban’ services and $28 per hour for ‘regional' services.
Ko te mahere ā-rohe me ngā rangapū | Regional Strategy and Partnerships
2022/23 Status of non-financial performance
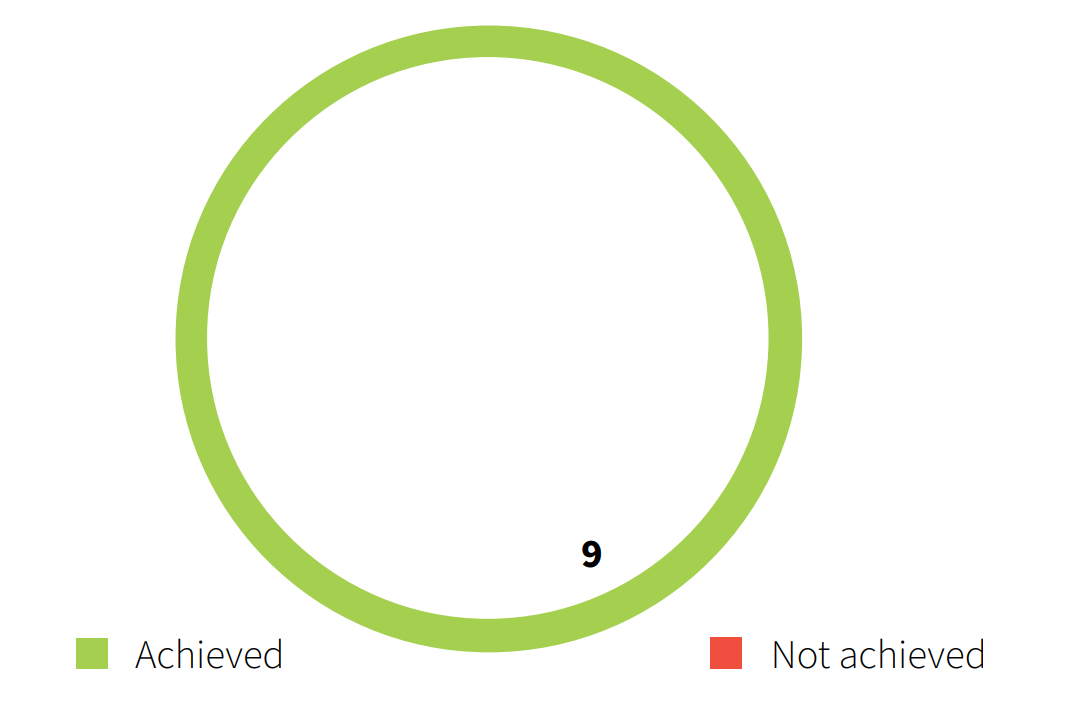
Greater Wellington’s Regional Strategy and Partnerships activities achieved 100 percent of their nine performance measures this year. 5
The challenges that we faced this year highlighted how important it is that we have strong relationships with our partners and communities in the Region. Cyclone Gabrielle had a big impact on us, particularly for communities in the Wairarapa. Recovery is an ongoing process, and for those affected it will be a part of their story for years to come. The Wellington Region Emergency Management Office (WREMO) continued to work with Greater Wellington managers and people leaders throughout the year to train staff and to improve our collective ability to activate and support the Emergency Coordination Centre.
This year we continued to work on building relationships and making connections so that we deliver our work in a coordinated way across the Region. We worked to make our regional transport system more connected this year through the development of the first Regional Speed Management Plan as part of Waka Kotahi’s Road to Zero project and developed a new strategic transport modelling tool. This tool can be used by us and our partners to decide together where to invest to make our transport network more connected and useful to people.
We also made connections across the Region this year by continuing to support the Wellington Regional Leadership Committee (WRLC). The WRLC is made up of representatives from territorial authorities, Greater Wellington, mana whenua and Central Government. We supported the WRLC work programme by contributing to regionally-focussed plans and strategies they are leading this year to reduce emissions, adapt to climate change and ensure we are developing in a way that supports future generations.
Partnership with people across the Region was a key focus for us this year, including partnership with mana whenua. We established a Long Term Plan Committee with representatives from all our mana whenua partners to develop our 2024-34 Long Term Plan. We also worked with our mana whenua partners on regional projects and continued to implement Te Whāriki – an outcomes-based framework for how we plan and deliver our work.
We also continued to work with our partners at WellingtonNZ to support sustainable economic growth through their Wellington Regional Economic Development Plan.
This year was also a local government election year. After a lot of work encouraging people to stand for Council and vote, we welcomed a new Council into Greater Wellington, with five new councillors and eight re-elected councillors. We supported our new Council once they were elected to ensure they had everything they needed to understand their role and represent their electorate.
5. See the ‘Measuring our Performance’ section of the full 2022/23 Annual Report.
Ngā Puna Wai | Water Supply
2022/23 Status of non-financial performance
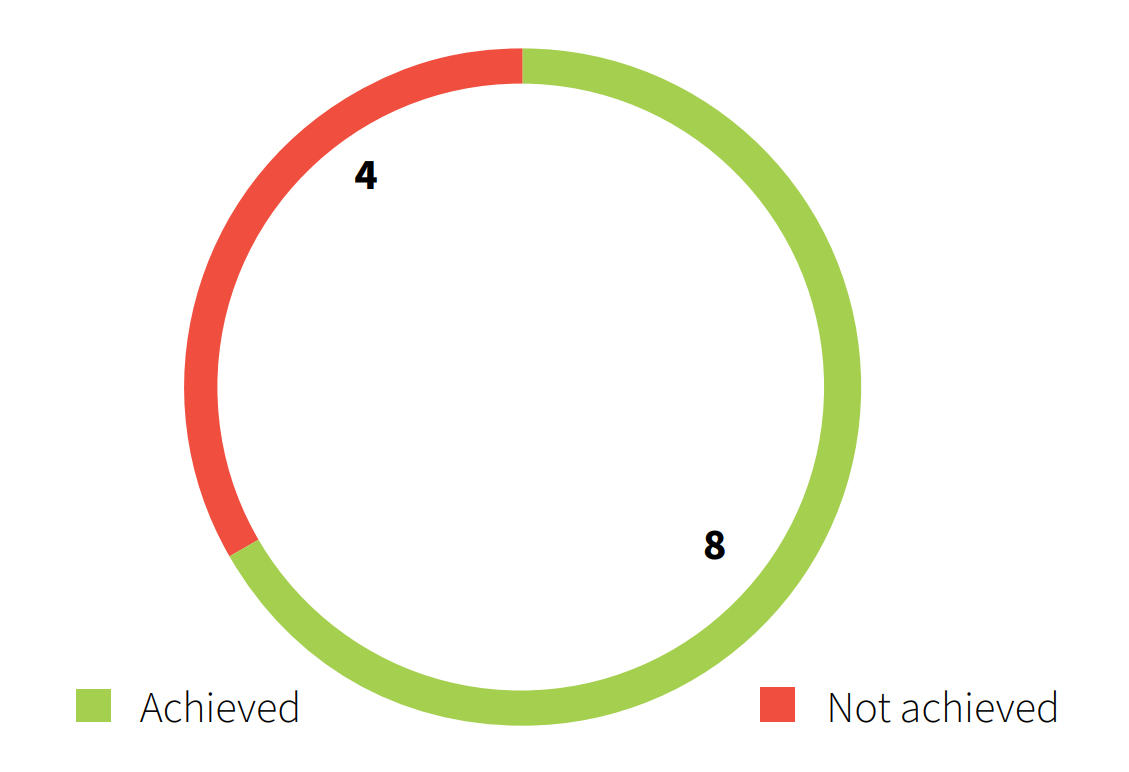
Greater Wellington’s Water Supply activities have achieved 67 percent of their twelve performance measures this year. 6
Improving the resilience of our water supply was a big focus this year. This is incredibly important as we start to see the impacts of climate change on our Region. Wellington Water Limited completed upgrades to both the Silverstream Pipe bridge and the Kaitoke Flume Bridge so that they will last long into the future and be more resistant to the impacts of natural disasters such as earthquakes.
Both the Silverstream and Kaitoke Pipe bridges are essential to water supply in Wellington Region. The Silverstream Pipe bridge is one of the Region’s most critical water supply pipelines, and Kaitoke Flume Bridge provides approximately 50 percent of the Region’s raw water supply. Therefore, it was important this year that we ensured both pieces of infrastructure are working properly and can continue to work for future generations.
We also did work this year to increase our capacity to deliver drinking water to the Region. This is important as our population grows and more water is needed. We started upgrades on the Te Marua Water Treatment Plant this year to increase the capacity of the plant however there have been delays while we ensure that we are properly protecting the plant from future earthquakes.
6. See the ‘Measuring our Performance’ section of the full 2022/23 Annual Report.
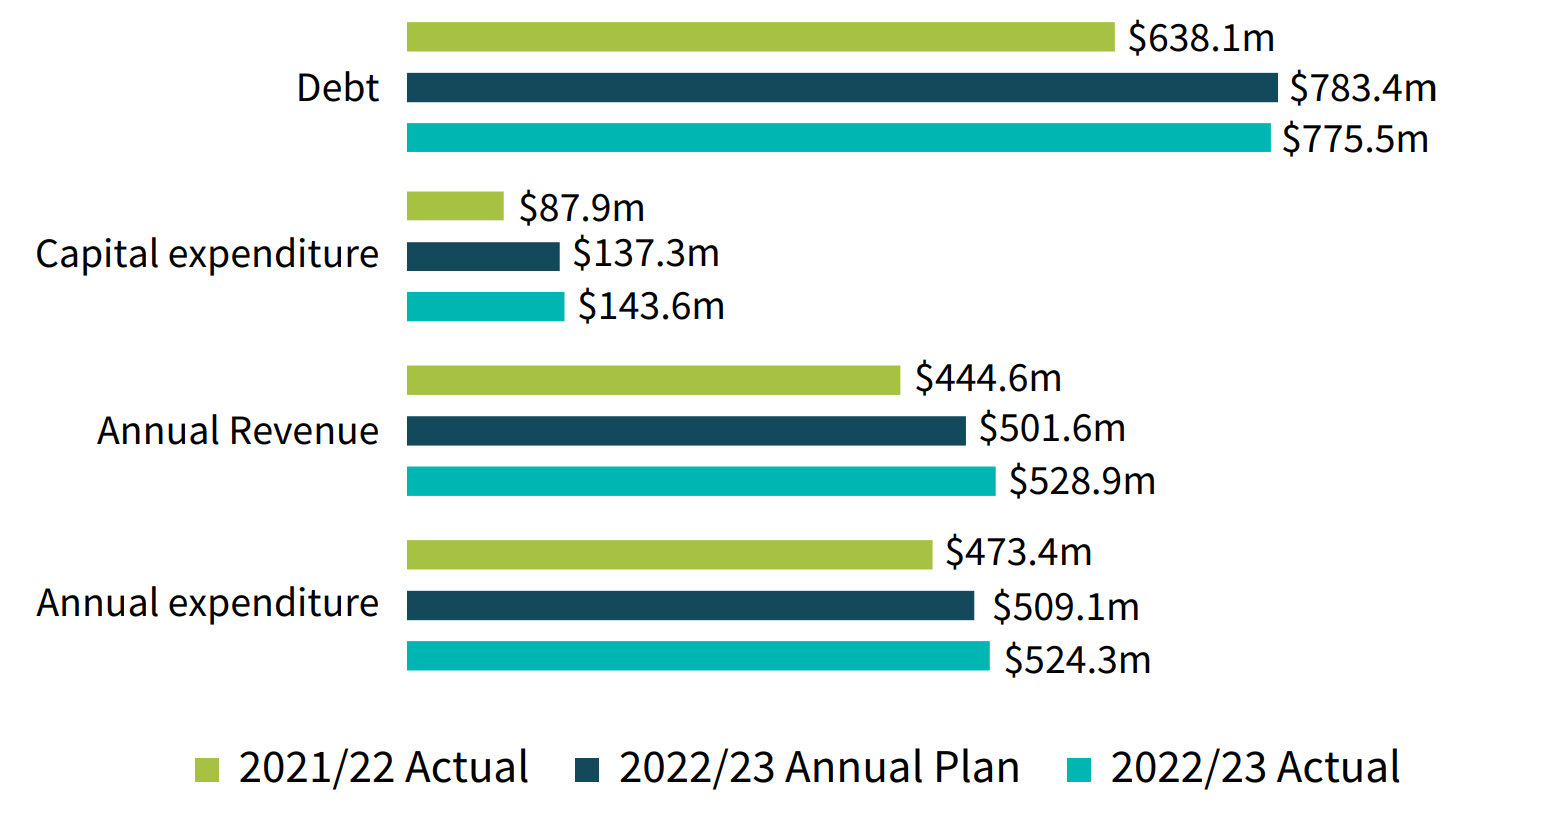
He Pūrongo Pūtea | Finances at a Glance
While the year has been one of economic challenges and financial pressures, overall Greater Wellington has had a successful financial year and performed very close to budgeted levels. Summary highlights from the year include:
- We received an AA+ credit rating with Standard & Poor's, which indicates a very strong capacity to meet financial commitments and good financial health overall.
- The cost of delivering all our services amounted to $6.8 per rating unit per day.
- Our total assets held this year were worth $2.162 billion.
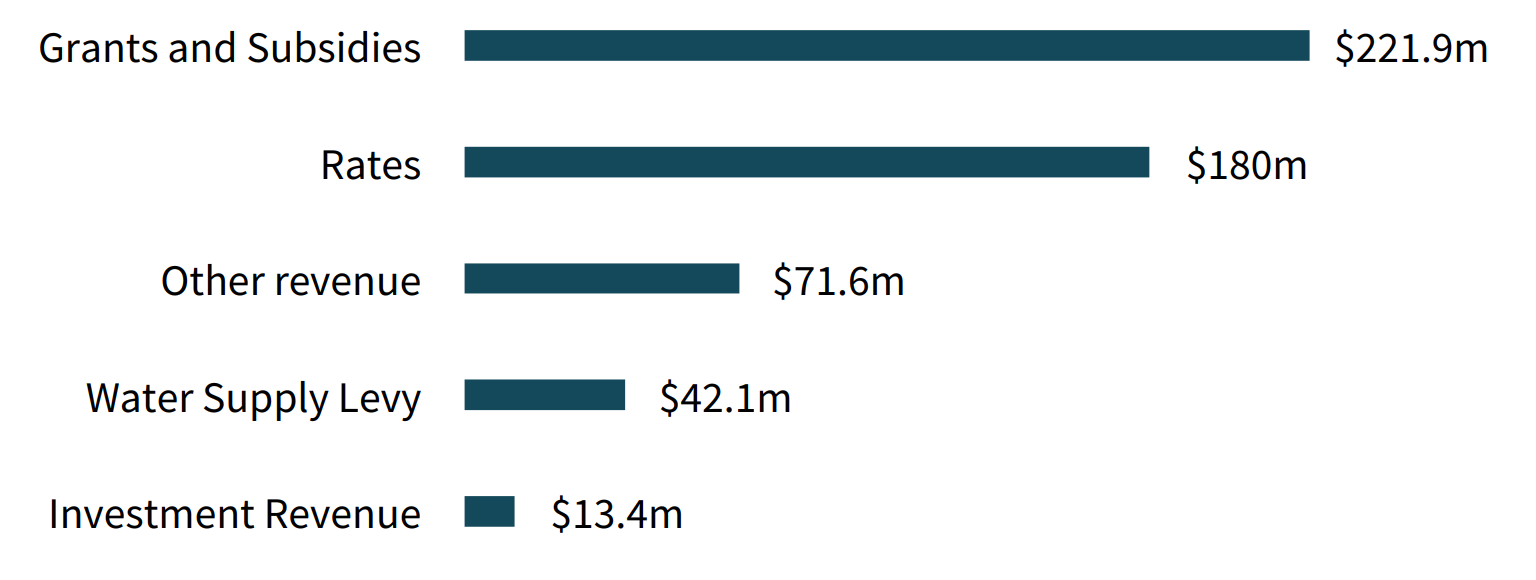
Greater Wellington's revenue is sourced primarily through rates and grants from central government. Other revenue sources include water supply levy, fees, charges, including public transport fares, and investment income.
- Our annual revenue from rates this year was $180 million.
- Revenue from grants and other sources was $348.9 million
Financial overview
Revenue
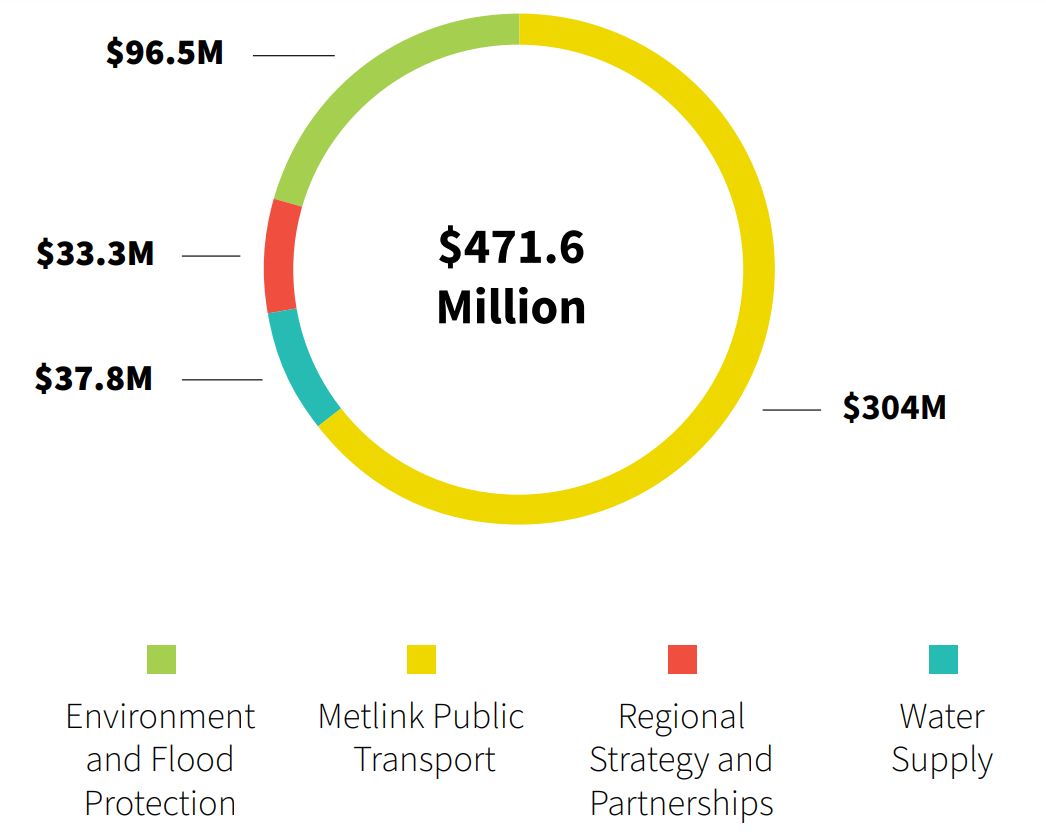
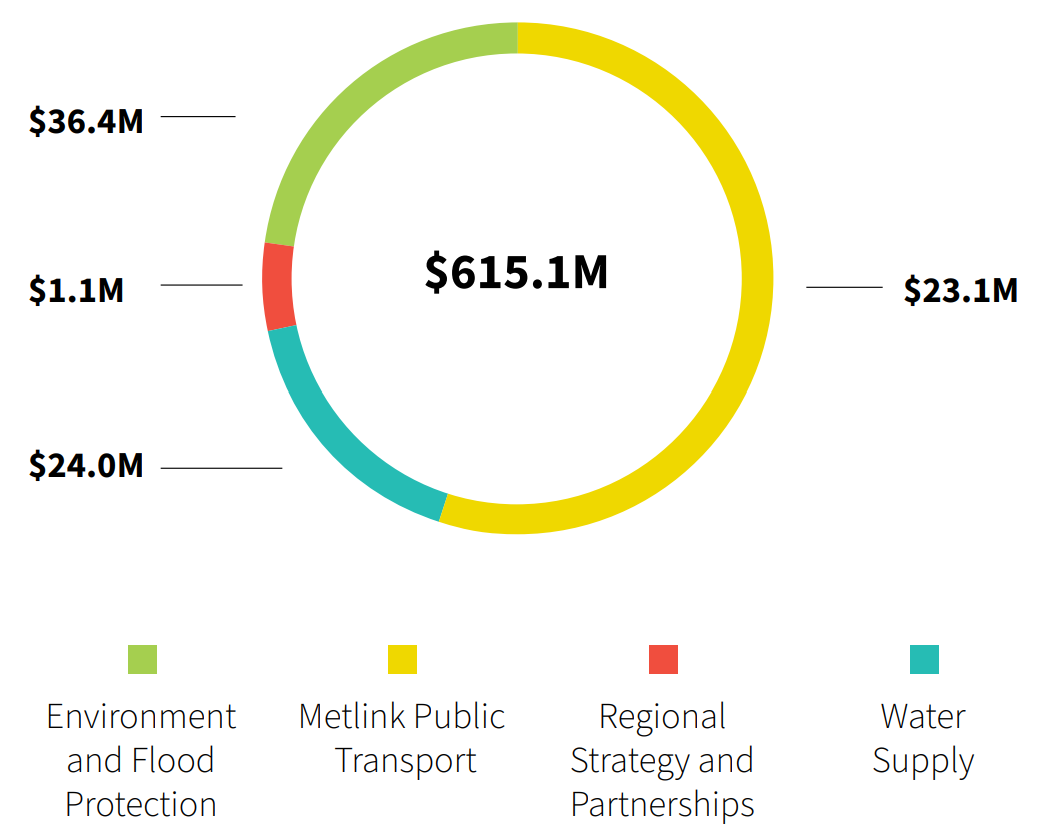
Operational expenditure by Activity Group
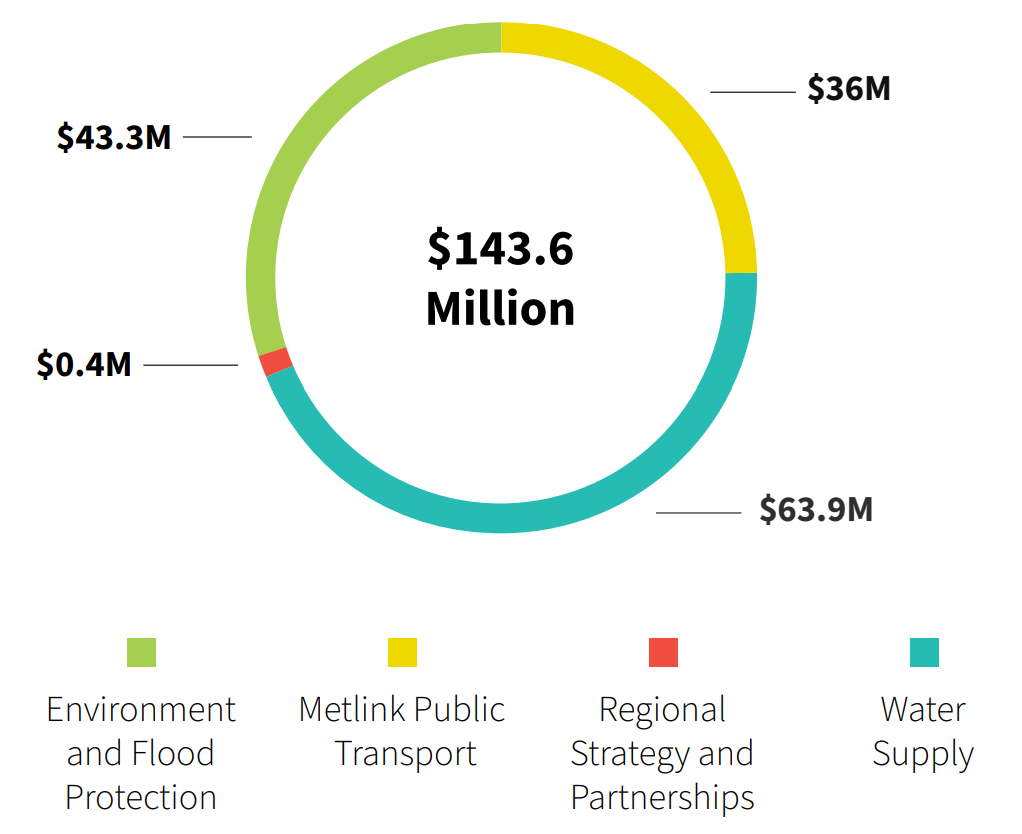
Capital expenditure by Activity Group
Property, plant, and equipment by Activity Group
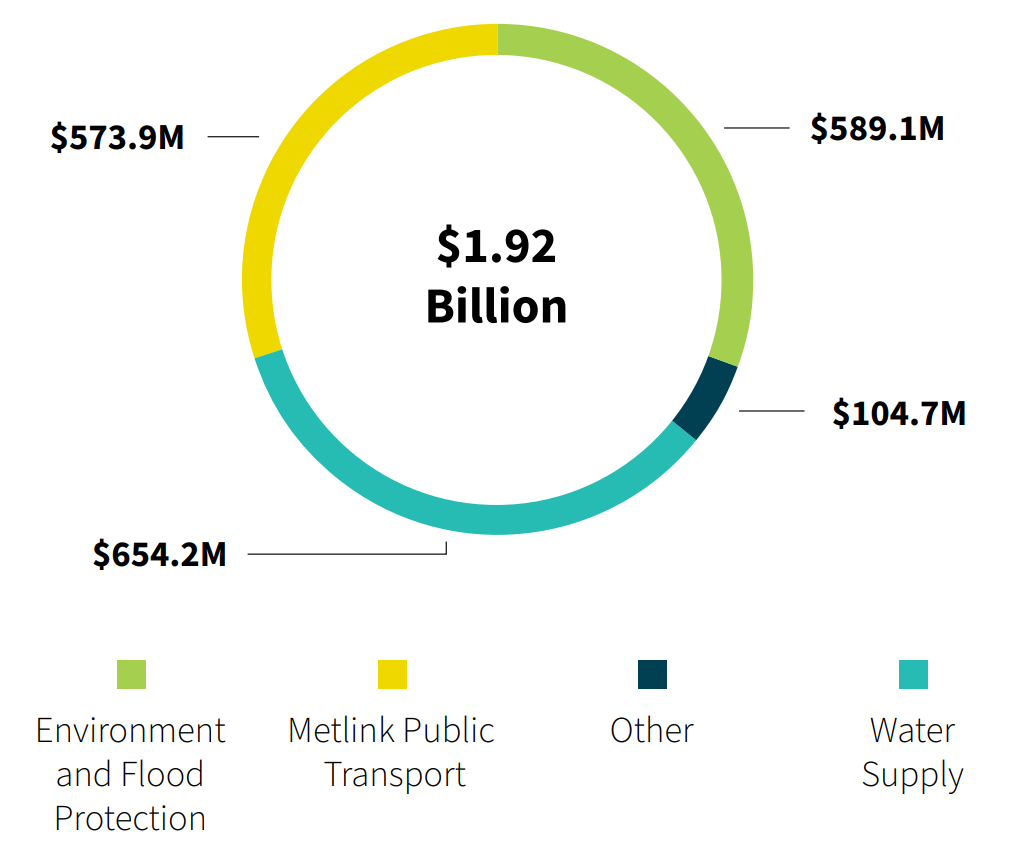
Total Expenditure (operational plus capital) by Activity Group
Financial Summary including key disclosure statements
Summary Statement of Comprehensive Revenue and Expense for the year ended 30 June 2023
| Greater Wellington Actual 2023 $'000 |
Greater Wellington Budget 2023 $'000 |
Greater Wellington Actual 2022 $'000 |
Greater Wellington Group Actual 2023 $'000 |
Greater Wellington Group Actual 2022 $'000 |
|
|---|---|---|---|---|---|
|
Operating revenue and gains |
528,664 |
501,605 |
443,933 |
628,619 |
532,261 |
|
Finance expenses |
(35,832) |
(22,768) |
(23,099) |
(35,549) |
(23,099) |
|
Operating expenditure |
(488,434) |
(486,368) |
(450,282) |
(612,111) |
(558,851) |
|
Operating surplus/(deficit) before other items and tax |
4,398 |
(7,531) |
(29,448) |
(19,041) |
(49,689) |
|
Share of associate's surplus/(deficit) |
- |
- |
- |
1,249 |
1,537 |
|
Impairment on buildings |
(36,720) |
- |
- |
(36,720) |
- |
|
Fair value - Other assets |
- |
- |
- |
- |
(21,000) |
|
Fair value gains / (losses) in profit and loss |
14,361 |
11,037 |
64,561 |
14,361 |
64,561 |
|
Fair value gain/(loss) on investment property |
- |
- |
- |
(1,509) |
4,842 |
|
Tax on continuing operations |
- |
- |
- |
8,821 |
10,548 |
|
Operating surplus / (deficit) after tax |
(17,961) |
3,506 |
35,113 |
(32,839) |
10,799 |
|
Other comprehensive revenue and expenses |
|
|
|
|
|
|
Increases / (decreases) in revaluations |
(49,544) |
10,524 |
131,894 |
(50,418) |
196,302 |
|
Total comprehensive revenue and expense |
(67,505) |
14,030 |
167,007 |
(83,257) |
207,101 |
|
|
|
|
|
|
|
|
Attributable to: |
|
|
|
|
|
|
Equity holders of the Parent |
(67,505) |
14,030 |
167,007 |
(87,608) |
215,217 |
|
Noncontrolling interest |
- |
- |
- |
4,351 |
(8,116) |
|
|
(67,505) |
14,030 |
167,007 |
(83,257) |
207,101 |
Summary statement of changes in equity for the year ended 30 June 2023
|
|
Greater Wellington Actual 2023 $'000 |
Greater Wellington Budget 2023 $'000 |
Greater Wellington Actual 2022 $'000 |
Greater Wellington Group Actual 2023 $'000 |
Greater Wellington Group Actual 2022 $'000 |
|---|---|---|---|---|---|
|
Opening equity |
1,305,881 |
1,243,848 |
1,137,997 |
1,844,488 |
1,637,897 |
|
Operating surplus /(deficit) after tax |
(17,961) |
3,506 |
35,112 |
(32,839) |
10,799 |
|
Dividend to noncontrolling interest |
- |
- |
- |
(1,385) |
(1,385) |
|
Asset revaluation movements |
(38,573) |
10,524 |
120,177 |
(39,447) |
184,585 |
|
Revaluation movement of other financial assets |
(10,971) |
- |
11,717 |
(10,971) |
11,717 |
|
Total closing equity at 30 June |
1,238,377 |
1,257,876 |
1,305,010 |
1,759,847 |
1,843,618 |
|
Attributable to: |
|
|
|
|
|
|
Equity holders of the Parent |
1,238,377 |
1,257,876 |
1,305,010 |
1,650,241 |
1,736,978 |
|
Noncontrolling interest |
- |
- |
- |
109,606 |
106,640 |
|
|
1,238,377 |
1,257,876 |
1,305,010 |
1,759,847 |
1,843,620 |
Summary statement of Financial Position as at 30 June 2023
|
Greater Wellington Actual 2023 $'000 |
Greater Wellington Budget 2023 $'000 |
Greater Wellington Actual 2022 $'000 |
Greater Wellington Group Actual 2023 $'000 |
Greater Wellington Group Actual 2022 $'000 |
|
|---|---|---|---|---|---|
|
Current assets |
279,613 |
171,483 |
217,898 |
408,723 |
375,511 |
|
Noncurrent assets |
1,882,446 |
1,973,815 |
1,849,552 |
2,413,379 |
2,375,355 |
|
Total assets |
2,162,059 |
2,145,298 |
2,067,450 |
2,822,102 |
2,750,866 |
|
|
|
|
|
|
|
|
Current liabilities |
278,161 |
219,973 |
218,235 |
285,561 |
222,230 |
|
Noncurrent liabilities |
645,521 |
667,449 |
544,205 |
776,694 |
685,018 |
|
Total liabilities |
923,682 |
887,422 |
762,440 |
1,062,255 |
907,248 |
|
Net assets |
1,238,377 |
1,257,876 |
1,305,010 |
1,759,847 |
1,843,618 |
|
|
|
|
|
|
|
|
Equity attributed to: |
|
|
|
|
|
|
Retained earnings |
323,767 |
340,208 |
331,247 |
620,817 |
647,696 |
|
Other reserves |
914,610 |
917,668 |
973,763 |
1,029,424 |
1,089,282 |
|
Minority interest |
- |
- |
- |
109,606 |
106,640 |
|
Total equity |
1,238,377 |
1,257,876 |
1,305,010 |
1,759,847 |
1,843,618 |
Summary statement of Cash-Flow for the year ended 30 June 2023
|
|
Greater Wellington Actual 2023 $'000 |
Greater Wellington Budget 2023 $'000 |
Greater Wellington Actual 2022 $'000 |
Greater Wellington Group Actual 2023 $'000 |
Greater Wellington Group Actual 2022 $'000 |
|---|---|---|---|---|---|
|
Cashflows from operating activities |
68,783 |
32,297 |
6,650 |
88,514 |
17,572 |
|
Cashflows from investing activities |
(205,470) |
(185,859) |
(101,022) |
(251,810) |
(164,552) |
|
Cashflows from financing activities |
137,413 |
153,962 |
106,214 |
137,028 |
108,329 |
|
Net increase / (decrease) in cash and cash equivalents |
726 |
400 |
11,842 |
(26,268) |
(38,651) |
|
Opening cash equivalents |
16,517 |
19,971 |
4,675 |
158,141 |
196,792 |
|
Closing cash equivalents |
17,243 |
20,371 |
16,517 |
131,873 |
158,141 |
Major variances between actual and budget
- Grants and subsidies revenue is significantly higher than budget mainly due to Waka Kotahi funding of half price fares and additional Crown funding to support loss fare revenue.
- Other revenue is lower than budget mainly due to lower patronage levels from reduced services and increase in working from home practises post covid and half price fares.
- Finance costs are significantly higher than budget due to rising interest costs.
- Fair value movements are unfavourable to budget due to impairment of Riverlink properties which more than offsets the favourable increase in the fair value of interest rate swaps due to the continuing increase in market interest rates.
- Current total assets are significantly higher than budget mainly due to additional funds received from Waka Kotahi and other surplus funds being invested in maturities not exceeding twelve months. The non-current assets balance is significantly lower than budget mainly due to reclassification of the Riverlink related properties to assets held for disposal and a downward movement in the price of emission units.
- Ratepayers equity is lower than the budget mainly due to the impairment loss of Riverlink properties which more than offsets the favourable fair value movements in interest rate swaps due to the continuing increase in market interest rates.
- Current liabilities are significantly higher than budget mainly due to the receipt of funds from Waka Kotahi for the Riverlink project and the timing of raising more short term debt and lower long term debt as reflected in the lower non-current liabilities against budget.
Events occurring after the balance date
Rates
In a recent rates modelling exercise undertaken by Greater Wellington, it was discovered the differentials on the Wellington city general rate had not been applied correctly since it was introduced in 2019/20. The impact of this meant Residential ratepayers have overpaid on average $30 per year, and Rural ratepayers have overpaid on average $36 per year. The CBD and business categories counterbalanced this over payment by underpaying, on average $2,331 for CBD and $641 for Business ratepayers. The total revenue collected for Greater Wellington was correct, hence the issue was not found earlier. This issue was corrected for the 2023/24 rating year.
Greater Wellington is working through practical solutions for resolving this issue and an unquantifiable contingent liability has been recognised in this regard.
Water services reform program
The New Zealand Government is implementing a water services reform program that is intended to ensure all New Zealanders have safe, clean and affordable water services. The Government believes this will be achieved by establishing new public entities to take on the delivery of drinking water, wastewater and stormwater services across New Zealand. The reform will be enacted by three pieces of legislation:
- The Water Services Entities Act 2022, which (as amended by the Water Services Entities Amendment Act 2023 on 23 August 2023) establishes ten publicly owned water services entities and sets out their ownership, governance and accountability arrangements. A water services entity is established (for transitional purposes) on the date on which the appointment of the entity’s establishment board takes effect, and its establishment date (operational date) will be a date between 1 July 2024 and 1 July 2026.
- The Water Services Legislation Act 2023, which amended the Water Services Entities Act 2022 on 31 August 2023 to provide for the transfer of water services assets and liabilities to the water services entities.
- The Water Services Economic Efficiency and Consumer Protection Act 2023, which provides the economic regulation and consumer protection framework for water services. The consumer protection framework will come into force on 1 July 2024 and the rest of the Act came into force on 31 August 2023
There were no other subsequent events up to the date of these financial statements which would affect the amounts or disclosures in the financial statements.
No dividend was declared post balance date by WRC Holdings (2022: Nil).
Disclaimer
The full financial statements presented in the 2022/23 Annual report have been audited.
Greater Wellington’s full financial statements have been prepared in accordance with Public Benefit entity (PBE) Accounting Standards.
Specific disclosures included in the summary financial statements have been extracted from the full financial statements. These financial statements contain no information that has been restated or reclassified.
The summary financial statements do not include all the disclosures provided in the full financial statements and cannot be expected to provide as complete an understanding as provided by the full financial statements.
The full financial statements can be obtained from the Greater Wellington website.
The full financial statements are denominated in NZ$.
The summary financial statements comply with PBE FRS 43 – Summary financial statements.
He Pūrongo Arotake Pūtea | Independent Audit Report
Independent Auditor’s Report
To the readers of the Greater Wellington Regional Council and group’s summary of the annual report for the year ended 30 June 2023
The summary of the annual report was derived from the annual report of the Greater Wellington Regional Council (the Regional Council) and Group for the year ended 30 June 2023.
The summary of the annual report comprises the following information:
- the summary statement of financial position as at 30 June 2023;
- the summaries of the statement of comprehensive revenue and expense, statement of
changes in equity and statement of cash-flow for the year ended 30 June 2023; - the notes to the summary financial statements that include other explanatory information;
and - the summary of non-financial performance.
Opinion
In our opinion:
- the summary of the annual report represents, fairly and consistently, the information regarding the major matters dealt with in the annual report; and
- the summary statements comply with PBE FRS‑43: Summary Financial Statements.
However, the summaries of non-financial performance information include a limitation in scope to the equivalent extent as the full audited statement of service provision. This limitation is explained below in the full annual report and our audit report thereon section.
Summary of the annual report
The summary of the annual report does not contain all the disclosures required by generally accepted accounting practice in New Zealand. Reading the summary of the annual report and the auditor’s report thereon, therefore, is not a substitute for reading the full annual report and the auditor’s report thereon.
The summary of the annual report does not reflect the effects of events that occurred subsequent to the date of our auditor’s report on the full annual report.
The full annual report and our audit report thereon
We expressed a qualified opinion on the statements of service provision and an unmodified opinion on the other audited information in the full annual report for the year ended 30 June 2023 in our auditor’s report dated 31 October 2023. The basis for our qualified opinion on the statements of service provision in the full audit report is explained below.
Statement of service provision: our work was limited in relation to measurement of greenhouse gas emissions
The Regional Council has chosen to include two measures of greenhouse gas emissions (GHG) emissions in its performance information.
The emissions reported in the performance year for both measures relates to estimated emissions generated in the previous year. That is, in the 2023 performance year, the Regional Council reports on the Regional Council and Group’s emissions from the year ended 30 June 2022.
We consider this material performance information because the Regional Council has declared a climate emergency and because of the public interest in climate change related information.
Reduction in tonnes of CO2 equivalent (tCO2e) emissions
The Regional Council’s performance information includes a performance measure on the quantity of GHG emissions from the Regional Council and Group. This includes emissions generated directly by the Group itself, emissions from the services that the Regional Council is responsible for (such as public transport) and emissions from the use of the Regional Council’s assets (such as grazing in regional parks). The Regional Council is still developing the systems and controls needed to produce reliable evidence to support the data inputs and estimations used in the measurement of GHG emissions. This includes the measurement of material emissions from public transport and grazing activities which rely on data from third parties. Therefore, we were unable to obtain sufficient appropriate evidence to conclude whether the reported performance is materially correct.
Tonnes of CO2 emitted per year on Metlink Public Transport Services
The Regional Council’s performance information also includes a performance measure specifically on the quantity of emissions generated from Metlink Public Transport services. For the same reason as above, we were unable to obtain sufficient appropriate evidence to conclude whether the reported performance is materially correct.
As a result of these issues, our work was limited and there were no practicable audit procedures we could apply to obtain assurance over the reported results for the two performance measures described above.
Our opinion on these performance measures was also qualified for the 2022 performance year.
Without further modifying our opinion, we also drew attention to the inherent uncertainty disclosure on page 28 of the full annual report, which outlines the inherent uncertainty in the reported GHG emissions. Quantifying GHG emissions is subject to inherent uncertainty because the scientific knowledge and methodologies to determine the emissions factors and processes to calculate or estimate quantities of GHG sources are still evolving, as are GHG reporting and assurance standards.
Emphasis of matter – uncertainty over the water services reform programme
Our auditor’s report on the full annual report also includes an emphasis of matter paragraph drawing attention to the uncertainty over the Government’s water services reform programme, as disclosed in note 34 to the financial statements in the full annual report.
The Water Services Entities Act 2022, as amended by the Water Services Entities Amendment Act 2023 on 23 August 2023 and the Water Services Legislation Act 2023 on 31 August 2023, establishes ten publicly owned water services entities to carry out responsibilities for the delivery of three waters services and related assets and liabilities currently controlled by local authorities. Water services entities’ establishment dates are staggered, with all the water services entities becoming operational between 1 July 2024 and 1 July 2026. The financial impact of the water services reform on the Regional Council remains uncertain until the relevant water services entity’s establishment date is known, and the allocation schedule of assets, liabilities, and other matters to be transferred is approved. Information about this matter is also disclosed under “Events occurring after the balance date – Water services reform program” of the summary financial statements.
Council’s responsibility for the summary of the annual report
The Council is responsible for preparing the summary of the annual report which includes preparing summary statements, in accordance with PBE FRS‑43: Summary Financial Statements.
Auditor’s responsibility
Our responsibility is to express an opinion on whether the summary of the annual report represents, fairly and consistently, the information regarding the major matters dealt with in the full annual report and whether the summary statements comply with PBE FRS 43: Summary Financial Statements.
Our opinion on the summary of the annual report is based on our procedures, which were carried out in accordance with the Auditor-General’s Auditing Standards, which incorporate the Professional and Ethical Standards and the International Standards on Auditing (New Zealand) issued by the New Zealand Auditing and Assurance Standards Board.
In addition to our audit and our report on the disclosure requirements we have performed a limited assurance engagement related to the Regional Council’s debenture trust deed, which is compatible with those independence requirements.
Other than these engagements we have no relationship with, or interests in, the Regional Council or its subsidiaries and controlled entities.

Clint Ramoo
Audit New Zealand
On behalf of the Auditor-General
Wellington, New Zealand
30 November 2023